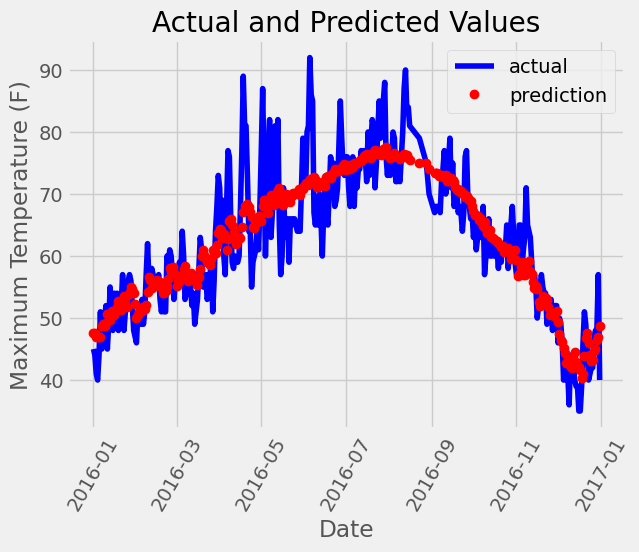
Pytorch 气温预测 电脑版发表于:2023/12/21 11:34  >#Pytorch 气温预测 [TOC] ## 准备数据集 tn2>下载`temps.csv`数据集。 ```bash # 下载包 !wget https://raw.githubusercontent.com/AiDaShi/learningpytorch/main/010_015%EF%BC%9A%E7%A5%9E%E7%BB%8F%E7%BD%91%E7%BB%9C%E5%AE%9E%E6%88%98%E5%88%86%E7%B1%BB%E4%B8%8E%E5%9B%9E%E5%BD%92%E4%BB%BB%E5%8A%A1/%E7%A5%9E%E7%BB%8F%E7%BD%91%E7%BB%9C%E5%AE%9E%E6%88%98%E5%88%86%E7%B1%BB%E4%B8%8E%E5%9B%9E%E5%BD%92%E4%BB%BB%E5%8A%A1/temps.csv -O temps.csv ``` tn2>接下来我们要完成以下步骤: 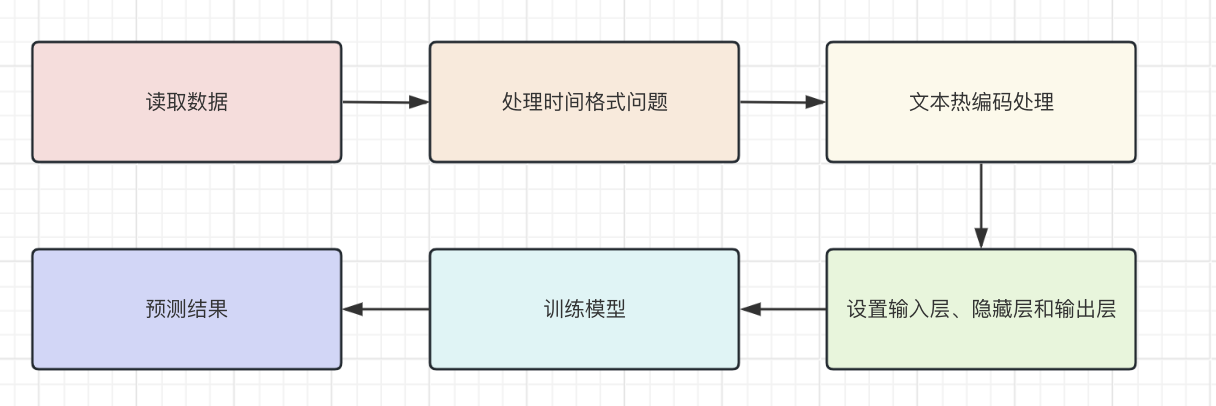 ## 开始编码 ### 读取数据 tn2>导入相关依赖包。 ```python import numpy as np import pandas as pd import matplotlib.pyplot as plt import torch import torch.optim as optim import warnings warnings.filterwarnings("ignore") %matplotlib inline ``` tn2>读取的csv数据。 ```python features = pd.read_csv('temps.csv') # 看数据长什么样子 features.head() ``` 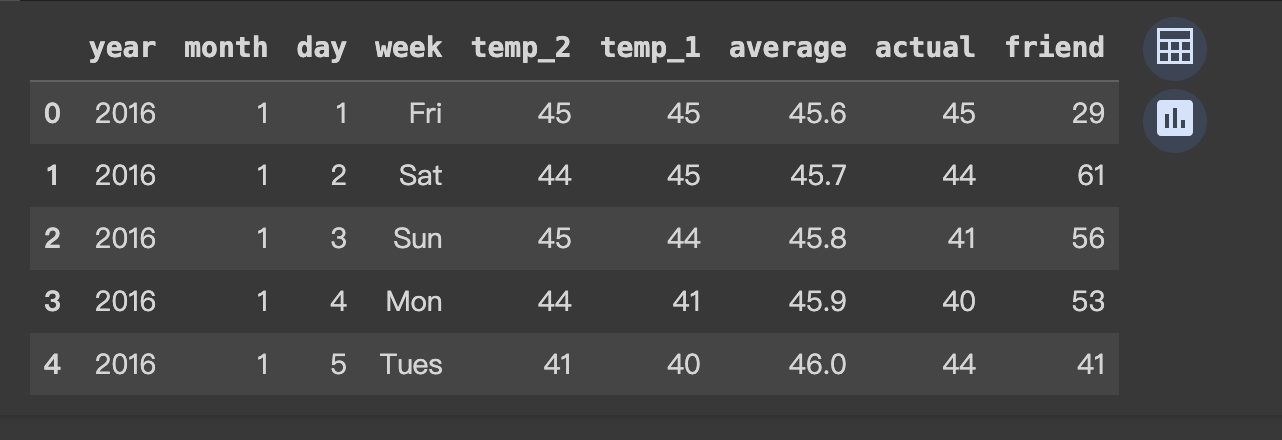 | 列名 | 描述 | | ------------ | ------------ | | year,moth,day,week|分别表示的具体的时间| | temp_2|前天的最高温度值| | temp_1|昨天的最高温度值| | average|在历史中,每年这一天的平均最高温度值| | actual|这就是我们的标签值了,当天的真实最高温度| | friend|这一列可能是凑热闹的,你的朋友猜测的可能值,咱们不管它就好了| ```python # 查看数据维度 print('数据维度',features.shape) ``` >数据维度 (348, 9) tn2>我们一共有348条,有九条数据列。 接着我们来处理一下时间格式。 ### 处理时间格式 ```python # 处理时间数据 import datetime # 分别得到年月日 years = features["year"] months = features["month"] days = features["day"] # datetime拼装与格式化 dates = [str(int(year)) + '-' + str(int(month))+'-'+str(int(day)) for year,month,day in zip(years,months,days)] dates = [datetime.datetime.strptime(date, '%Y-%m-%d') for date in dates] # 查看前5条数据 dates[:5] ``` >[datetime.datetime(2016, 1, 1, 0, 0), datetime.datetime(2016, 1, 2, 0, 0), datetime.datetime(2016, 1, 3, 0, 0), datetime.datetime(2016, 1, 4, 0, 0), datetime.datetime(2016, 1, 5, 0, 0)] ```python # 准备画风 # 指定默认风格 # plt.style.use('ggplot') plt.style.use('fivethirtyeight') # 设置布局 fig, ((ax1, ax2), (ax3, ax4)) = plt.subplots(nrows=2, ncols=2, figsize=(10, 10)) fig.autofmt_xdate(rotation=45) # 标签值 第一个参数是x,第二个参数是y ax1.plot(dates, features["actual"], c="blue") ax1.set_title("Max Temp");ax1.set_ylabel("Temperature");ax1.set_xlabel("") # 昨天 ax2.plot(dates, features["temp_1"], c="red") ax2.set_title("Previous Max Temp");ax2.set_ylabel("Temperature");ax2.set_xlabel("") # 今天 ax3.plot(dates, features["temp_2"], c="green") ax3.set_title("Two Days Prior Max Temp");ax3.set_ylabel("Temperature");ax3.set_xlabel("Date") # 朋友 ax4.plot(dates, features["friend"], c="pink") ax4.set_title("Friend Estimate");ax3.set_ylabel("Temperature");ax3.set_xlabel("Date") # 子图边缘与图表边缘之间的填充量为2 plt.tight_layout(pad=2) ``` 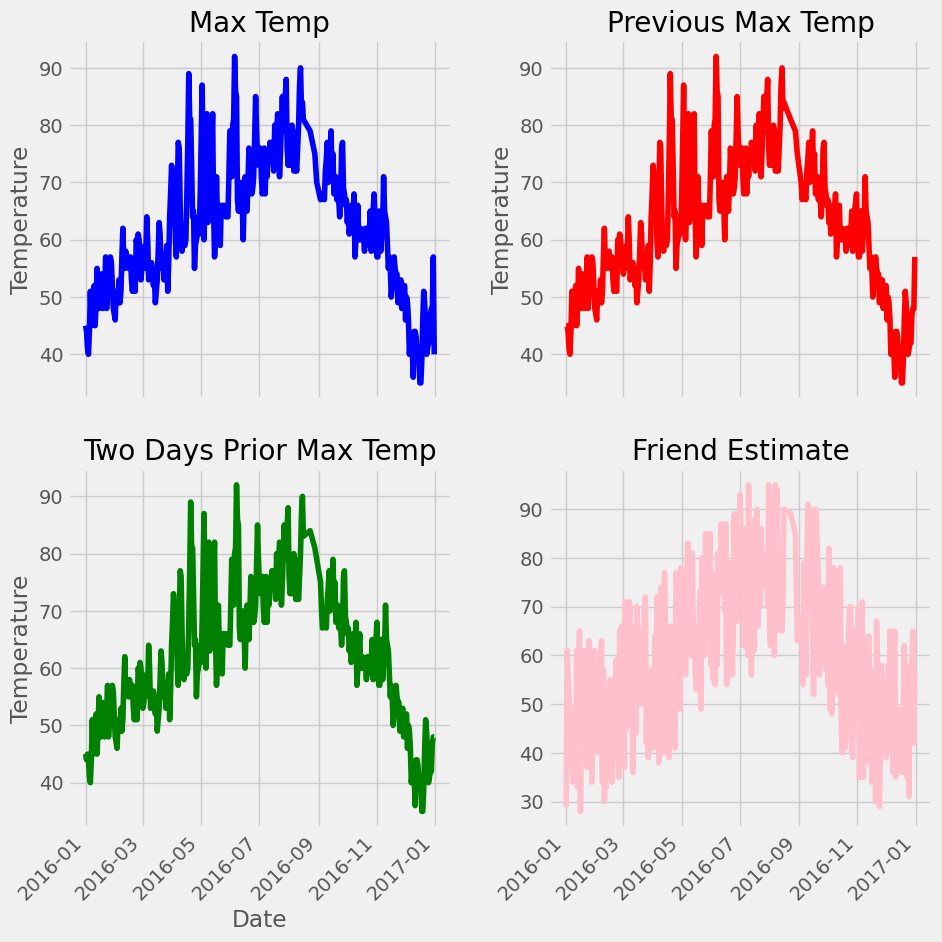 tn2>由于week列它是字符串,我们可以通过独热编码将它进行转换成我们想要的数值形式。 对我们需要字符的列进行额外的编码。 ### 文本热编码处理 tn2>`pd.get_dummies`方法它可以把包含有限几种类别的列(例如文本或分类数据)转换为数值形式。 ```python # 独热编码 features = pd.get_dummies(features) features.head(5) ```  tn2>接下来我们先把正确的标签列提出来,然后在特征中去掉标签,方便以后训练使用。 ```python # 标签 labels = np.array(features["actual"]) # 在特征中去掉标签 features = features.drop("actual", axis=1) # 名字单独保存一下,以备后患 feature_list = list(features.columns) # 转换成合适的格式 features = np.array(features) ``` ```python # 查看维度 features.shape ``` >(348, 14) ### 正态分布 ```python from sklearn import preprocessing input_features = preprocessing.StandardScaler().fit_transform(features) ``` | 相关代码 | 描述 | | ------------ | ------------ | | `scikit-learn` |库进行特征标准化的操作| | `StandardScaler`| 是用于标准化特征的工具,它通过移除均值并缩放到单位方差来标准化特征。| | `.fit_transform(features)`| 方法首先计算了features的均值和标准差,然后使用这些参数将数据转换成标准化的形式| tn2>最后的结果按照标准正态分布(均值为0,标准差为1)转换后的版本 ```python # 查看其中一条数据 input_features[0] ``` >array([ 0. , -1.5678393 , -1.65682171, -1.48452388, -1.49443549, -1.3470703 , -1.98891668, 2.44131112, -0.40482045, -0.40961596, -0.40482045, -0.40482045, -0.41913682, -0.40482045]) tn>使用正态分布的好处在于收敛的速度快一些,收敛的误差更小一点 ### 设置层级 ```python # 转换torch支持的格式 x = torch.tensor(input_features, dtype=float) y = torch.tensor(labels, dtype=float) # 权重参数初始化 # 这里把14个特征转换成128个隐藏特征(输入层有14个节点,而隐藏层有128个节点。) weights = torch.randn((14,128), dtype=float, requires_grad=True) # 创建了一个长度为128的一维张量,代表第一个隐藏层的偏置。 biases = torch.randn(128,dtype = float, requires_grad=True) # 表示从第一个隐藏层到输出层的权重。这里假设输出层只有一个节点(常见于二分类或单值回归问题) weights2 = torch.randn((128,1), dtype=float, requires_grad=True) # 创建了一个单元素张量,代表输出层的偏置。 biases2 = torch.randn(1,dtype = float, requires_grad=True) # 学习率 learning_rate = 0.001 # 损失 losses = [] ``` 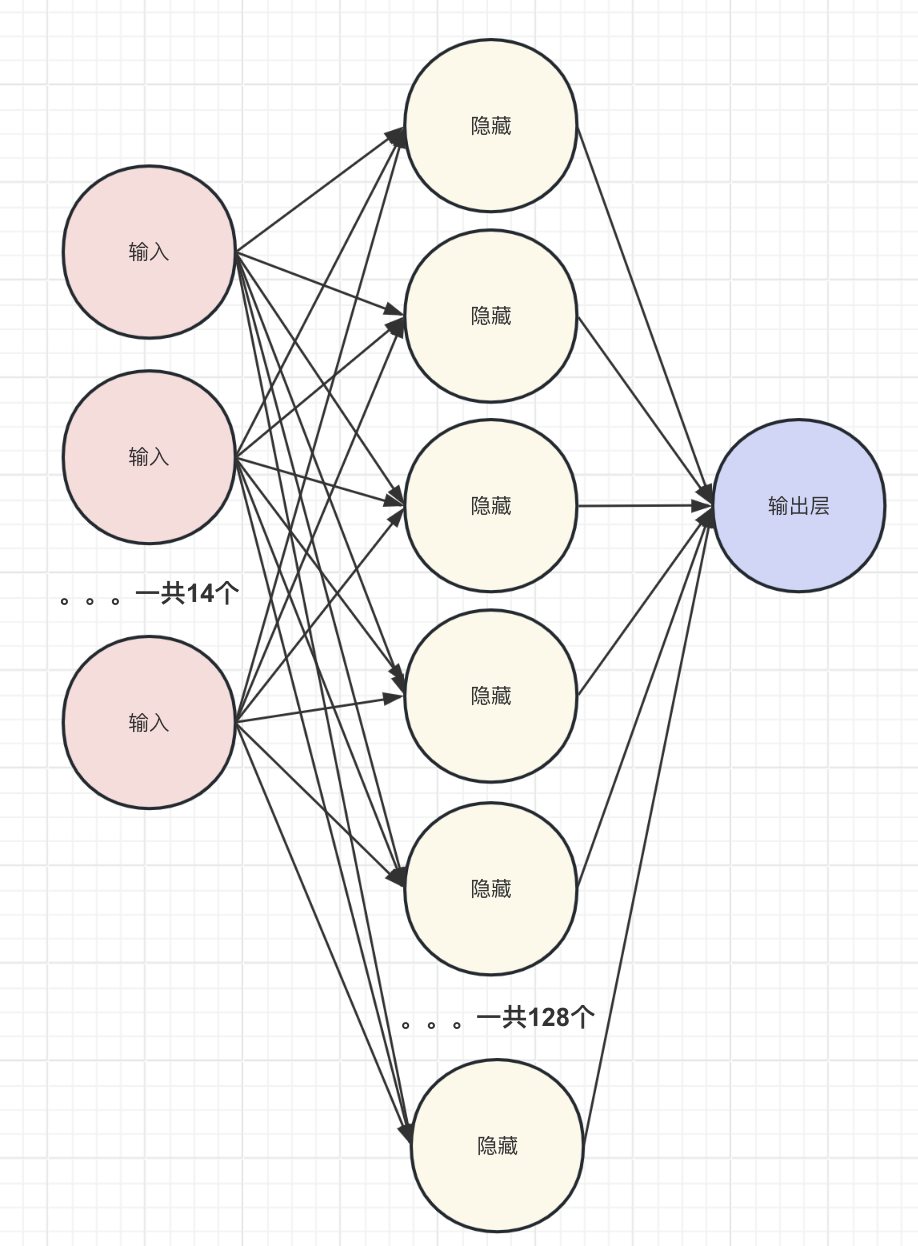 ### 训练模型 tn2>训练模型的步骤如下图所示: 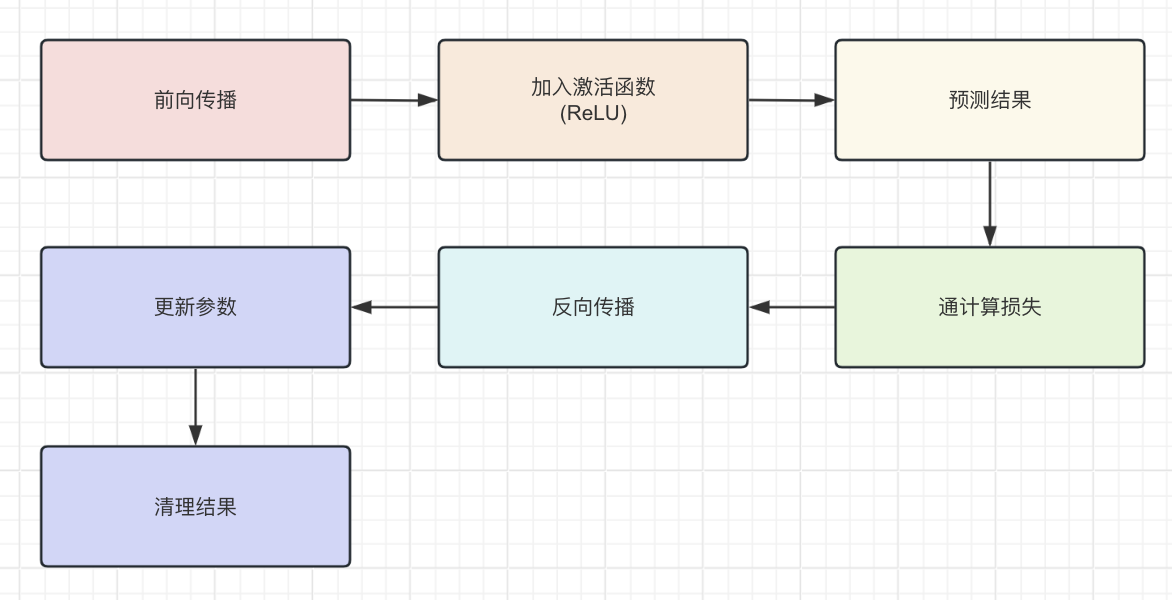 ```python for i in range(1000): # 前向传播(计算隐藏层) hidden = x.mm(weights) + biases # 加入激活函数 hidden = torch.relu(hidden) # 预测结果 output = hidden.mm(weights2) + biases2 # 通计算损失 loss = torch.mean((output - y)**2) losses.append(loss.data.numpy()) # 打印损失值 if i % 100 == 0: print('loss:',loss) # 反向传播 loss.backward() # 更新参数 weights.data.add_(-learning_rate * weights.grad.data) biases.data.add_(-learning_rate * biases.grad.data) weights2.data.add_(-learning_rate * weights2.grad.data) biases2.data.add_(-learning_rate * biases2.grad.data) # 更新参数 weights.grad.data.zero_() biases.grad.data.zero_() weights2.grad.data.zero_() biases2.grad.data.zero_() ``` >loss: tensor(5887.5310, dtype=torch.float64, grad_fn=<MeanBackward0>) loss: tensor(152.7882, dtype=torch.float64, grad_fn=<MeanBackward0>) loss: tensor(147.1391, dtype=torch.float64, grad_fn=<MeanBackward0>) loss: tensor(144.9651, dtype=torch.float64, grad_fn=<MeanBackward0>) loss: tensor(143.6304, dtype=torch.float64, grad_fn=<MeanBackward0>) loss: tensor(142.7190, dtype=torch.float64, grad_fn=<MeanBackward0>) loss: tensor(142.0560, dtype=torch.float64, grad_fn=<MeanBackward0>) loss: tensor(141.5524, dtype=torch.float64, grad_fn=<MeanBackward0>) loss: tensor(141.1599, dtype=torch.float64, grad_fn=<MeanBackward0>) loss: tensor(140.8559, dtype=torch.float64, grad_fn=<MeanBackward0>) tn2>我们可以看到误差在慢慢变小。 ### 更简单的构建网络模型 tn2>这里使用了 `Sigmoid` 函数的特点是它能够将任何实数值映射到 (0, 1) 区间内,这使得它非常适合用于将任意值转换为概率。 | 方法 | 描述 | | ------------ | ------------ | | ` torch.nn.Linear` | 是一个模块,用于创建一个线性变换。 | |`torch.nn.MSELoss` |是一个损失函数,用于计算均方误差(Mean Squared Error, MSE)。它主要用于回归任务。| |`torch.optim.SGD`| 是随机梯度下降(Stochastic Gradient Descent, SGD)优化器的实现。| ```python # 输入层数量 input_size = input_features.shape[1] # 确定输入特征的数量 # 输出层数量 output_size = 1 # 隐藏层数量 hidden_size = 128 # 批量处理大小,指定了每次训练过程中同时处理的数据样本数量 batch_size = 16 # 构建神经网络模型 my_nn = torch.nn.Sequential( torch.nn.Linear(input_size, hidden_size), # 添加输入层到隐藏层 torch.nn.Sigmoid(),# 在隐藏层后添加Sigmoid激活函数 torch.nn.Linear(hidden_size, output_size) # 添加隐藏层到输出层 ) cost = torch.nn.MSELoss(reduction='mean') # 使用均方误差损失函数,用于回归问题 optimizer = torch.optim.SGD(my_nn.parameters(), lr=0.001) # 使用随机梯度下降优化器,学习率设为0.001 ``` ```python # 损失集合 losses = [] for i in range(1000): # 迭代1000次 batch_loss = [] # 用于存储每个批次的损失 # MINI-Batch 方法来进行训练 for start in range(0, len(input_features), batch_size): # 计算批次的结束索引 end = start + batch_size if start + batch_size < len(input_features) else len(input_features) # 从输入特征和标签中获取当前批次的数据 xx = torch.tensor(input_features[start:end], dtype=torch.float,requires_grad=True) yy = torch.tensor(labels[start:end], dtype=torch.float,requires_grad=True) # 通过网络进行前向传播得到预测结果 prediction = my_nn(xx) # 计算损失 loss = cost(prediction, yy) # 清除之前的梯度 optimizer.zero_grad() # 反向传播,计算梯度 loss.backward(retain_graph=True) # 更新权重 optimizer.step() # 记录批次损失 batch_loss.append(loss.data.numpy()) # 打印损失 if i % 100 == 0: losses.append(np.mean(batch_loss)) print(i, np.mean(batch_loss)) ``` >0 1322.4116 100 37.27904 200 36.839382 300 36.445923 400 36.126297 500 35.88112 600 35.694214 700 35.547215 800 35.425312 900 35.318115 tn2>预测训练结果 ```python x = torch.tensor(input_features, dtype=torch.float) prediction = my_nn(x).data.numpy() ``` ```python # 转换日期格式 datas = [str(int(year)) + '-' + str(int(month)) + '-' + str(int(day)) for year, month, day in zip(years,months,days)] datas = [datetime.datetime.strptime(data, '%Y-%m-%d') for data in datas] # 创建一个表格来存日期和其对应的标签数值 true_data = pd.DataFrame(data={'date':datas, 'actual':labels}) # 同理,再创建一个来存日期和其对应的模型预测值 months = features[:, feature_list.index('month')] days = features[:, feature_list.index('day')] years = features[:, feature_list.index('year')] test_dates = [str(int(year)) + '-' + str(int(month)) + '-' + str(int(day)) for year, month, day in zip(years,months,days)] test_dates = [datetime.datetime.strptime(data, '%Y-%m-%d') for data in test_dates] prediction_data = pd.DataFrame(data={'date':test_dates, 'prediction':prediction.reshape(-1)}) ``` ```python # 真实值 plt.plot(true_data['date'], true_data['actual'], 'b-', label = 'actual') # 预测值 plt.plot(prediction_data['date'], prediction_data['prediction'], 'ro', label = 'prediction') plt.xticks(rotation = 60); plt.legend() # 图名 plt.xlabel('Date'); plt.ylabel('Maximum Temperature (F)'); plt.title('Actual and Predicted Values'); ``` 