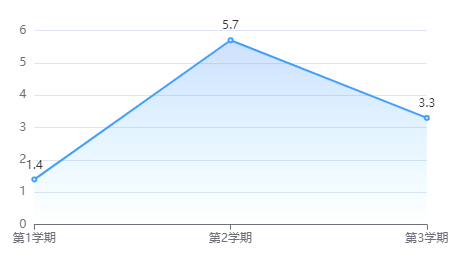
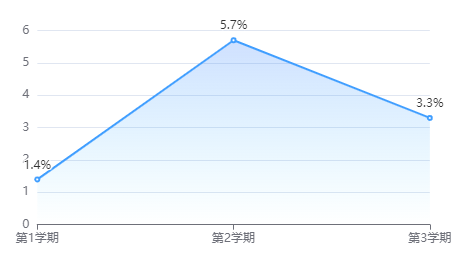
echarts 显示坐标点。echarts 自定义显示坐标点。echarts 个性化坐标提升显示, 电脑版发表于:2021/6/29 18:28 ### 最简单的显示出来,直接在series中对应的数据项里边设置一下label即可 ``` label: { show: true, position: 'top' } ``` 完整一点的: ``` series: [ { //这里显示坐标点信息 label: { show: true, position: 'top' }, data: labClassStatisticsChartData.ySeriesData, //data: [32, 51, 41, 49,55,60,30,39,50,22], type: 'line', //显示出来折线图的面积 areaStyle: { normal: { // 颜色渐变函数 前四个参数分别表示四个位置依次为左、下、右、上 color: new this.$echarts.graphic.LinearGradient(0, 0, 0, 1, [{ offset: 0, color: 'rgba(80,141,255,0.39)' }, { offset: 0.34, color: 'rgba(56,155,255,0.25)' }, { offset: 1, color: 'rgba(38,197,254,0.00)' }]) } } } ] ``` 效果如下:  **label里边的属性还可以支持设置,颜色,字体大小等等** 比如我们这里设置了一下字号fontSize,以及文字偏移offset ``` label: { fontSize:15, //是否对文字进行偏移。默认不偏移。例如:[30, 40] 表示文字在横向上偏移 30,纵向上偏移 40。 offset:[30,40], show: true, position: 'top' } ``` 还有很多可以设置的属性,看文档就知道了: https://echarts.apache.org/zh/option.html#series-line.label ### 使用formatter函数格式化输出 比如我这里在数值加了一个百分号: ``` label: { // 格式化输出 formatter: function (params) { console.log(params) return params.value+"%"; }, show: true, position: 'top' } ``` 效果如下:  关于formatter函数使用的官方文档: https://echarts.apache.org/zh/option.html#series-line.label.formatter