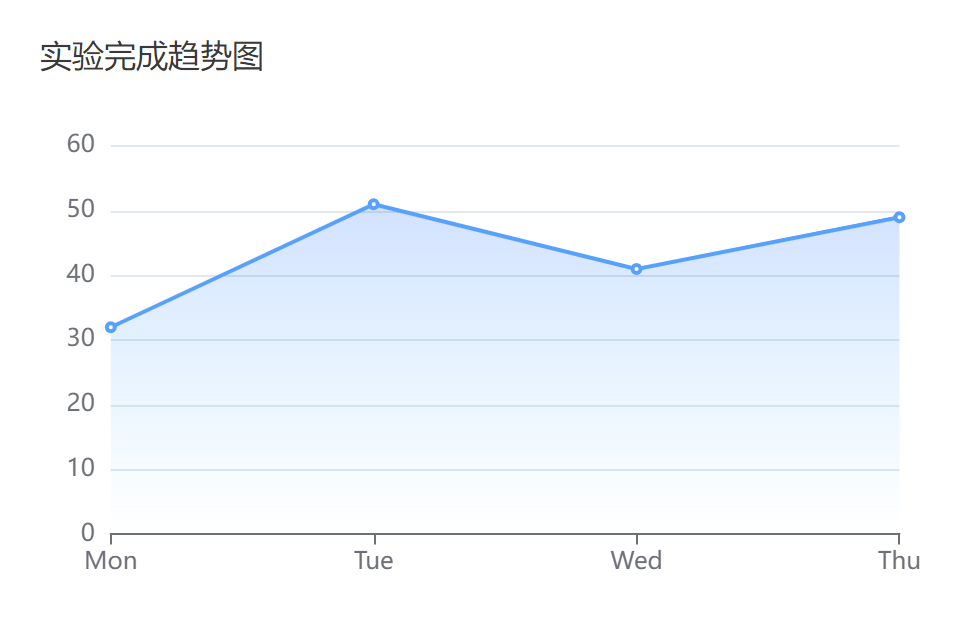
echart常用折线图,带面积渐变的折线图 电脑版发表于:2020/5/16 21:31 ### 效果如下:  **html:** ``` <div class="labroom-trend"> <div class="labroom-trend-title"> 实验完成趋势图 </div> <div class="labroom-trend-content"> <div id="labroom-trend-chart" class="labroom-trend-chart"> </div> </div> </div> ``` **样式也贴一点吧** ``` .labroom-trend { //height: 200px; // background-color: #ffabcd; .labroom-trend-title { font-size: 16px; font-family: MicrosoftYaHei-, MicrosoftYaHei; font-weight: normal; color: #393939; margin-bottom: 10px; } .labroom-trend-chart { // background-color: #ffabcd; height: 255px; width: 100%; } } ``` **js,vue.js** ``` mounted() { this.testChart() }, // 组件方法 methods: { testChart() { // 基于准备好的dom,初始化echarts实例 let myChart = this.$echarts.init(document.getElementById('labroom-trend-chart')) let option = { // 图表颜色设置 color: ['#409EFF', '#00DDFF', '#37A2FF', '#FF0087', '#FFBF00'], // title: { // text: '学习时长趋势(日时长)', // textAlign: 'left', // left: '27px', // top: 10, // textStyle: { // fontSize: '16px', // fontFamily: 'Microsoft YaHei' // } // }, grid: { top: '10%', left: '3%', right: '3%', bottom: '6%', containLabel: true }, xAxis: { type: 'category', data: ['Mon', 'Tue', 'Wed', 'Thu'], //****************不留白,从原点开始************** boundaryGap: false // 不留白,从原点开始 //data: ['Mon', 'Tue', 'Wed', 'Thu',"1","3","5","7","8","9"] }, yAxis: { type: 'value' }, series: [ { data: [32, 51, 41, 49], //data: [32, 51, 41, 49,55,60,30,39,50,22], type: 'line', //显示出来折线图的面积 areaStyle: { normal: { // 颜色渐变函数 前四个参数分别表示四个位置依次为左、下、右、上 color: new this.$echarts.graphic.LinearGradient(0, 0, 0, 1, [{ offset: 0, color: 'rgba(80,141,255,0.39)' }, { offset: 0.34, color: 'rgba(56,155,255,0.25)' }, { offset: 1, color: 'rgba(38,197,254,0.00)' }]) } } } ] }; myChart.setOption(option); } } ``` #### 在贴几个渐变颜色组合 **一:** 折线的颜色:#409EFF ``` // 图表颜色设置 color: ['#409EFF'] ``` 渐变色值: ``` // 显示出来折线图的面积 areaStyle: { normal: { // 颜色渐变函数 前四个参数分别表示四个位置依次为左、下、右、上 color: new this.$echarts.graphic.LinearGradient(0, 0, 0, 1, [{ offset: 0, color: 'rgba(64,159,255,0.25)' }, { offset: 0.34, color: 'rgba(56,155,255,0.22)' }, { offset: 1, color: 'rgba(38,197,254,0.00)' }]) } } ``` **二:** 折线的颜色:#8AABFF 渐变色值: ``` // 显示出来折线图的面积 areaStyle: { normal: { // 颜色渐变函数 前四个参数分别表示四个位置依次为左、下、右、上 color: new this.$echarts.graphic.LinearGradient(0, 0, 0, 1, [{ offset: 0, color: 'rgba(138, 171, 255,0.25)' }, { offset: 0.34, color: 'rgba(35,160,255,0.22)' }, { offset: 1, color: 'rgba(32,126,255,0.00)' }]) } } ``` **三:** 折线的颜色:#31C3F5 渐变色值: ``` // 显示出来折线图的面积 areaStyle: { normal: { // 颜色渐变函数 前四个参数分别表示四个位置依次为左、下、右、上 color: new this.$echarts.graphic.LinearGradient(0, 0, 0, 1, [{ offset: 0, color: 'rgba(40, 205, 255,0.25)' }, { offset: 0.34, color: 'rgba(35,215,255,0.22)' }, { offset: 1, color: 'rgba(32,197,254,0.00)' }]) } } ```